Annuities
For decades annuities have been one of the most polarizing topics in the retirement community. I was always warned to stay away from annuities because of their high costs, long surrender schedules and “smoke-and-mirror” features. About 10 years ago I was introduced to an annuity that would change the way I view them, well at least some of them. Most annuities do deserve caution tape, but if you use the right ones in the right way they can have a positive impact on a retirement portfolio. I’m going to explain what to look for and how to use them.
The Anatomy of an Annuity
There are several different types of annuities and the type we are going to discuss are called Equity Index Annuities (index annuities). I am not going to discuss Variable Annuities (VA) for the sake of time, but for full disclosure, I’m not a fan (yes there is always an exception). Let’s start by discussing how an index annuity works and how to identify the pitfalls that can accompany them.
For starters, an annuity has a surrender term just like a CD. The average is around 10 years. If you withdraw all of your money within 10 years of starting the annuity you will pay penalty fees. That being said, each year you’re allowed to withdraw a small percentage without penalties or charges, normally between 5% and 10% of the annuity value. If you withdraw more than this in any given year, you will face penalty charges for the excess. The limited liquidity of annuities is a downside that must be planned for accordingly.
An index annuity is unique in that the value can’t go lower than the initial premium because you’re initial deposit is guaranteed, but you still get to participate in market gains. Each year your annuity will earn interest that is credited based on the return of a market index or blended index. For example, if your annuity credits you 50% of the S&P return in each given year, you will receive half of the return, minus any stated fee, subject to a cap (maximum).
Illustrated – if the S&P 500 index returns 15% and you pay an annual fee of 1%, you will receive a credited rate of 7.5% (50% of the gain) minus the 1% fee for a total return of 6.5%. This can be a very useful strategy because the annuity will return 0% in any year that the market declines, but still give you upside in the years it increases.
The pitfall is simple, most of these annuities cap your upside potential and have high fees. In the above example, if the contract has a cap of 5%, your 6.5% return would be reduced to 5%. You will be restricted to a return of 0 – 5% every year. This makes the strategy much less appealing because you don’t really get the full market upside. Also, your 1% annual fee or spread is now at least 20% of your return potential. The good news is that there are some annuities that participate in market upside without capping your returns.
These are the annuities we focus on finding productive ways to use in retirement planning.
Let’s visualize how an annuity with the above pricing would have theoretically performed during two different 10-year periods. The annuity will credit 50% of the S&P 500 upside each year with a 1% fee that only charges if there is gain, and there is no cap on the upside in positive years.
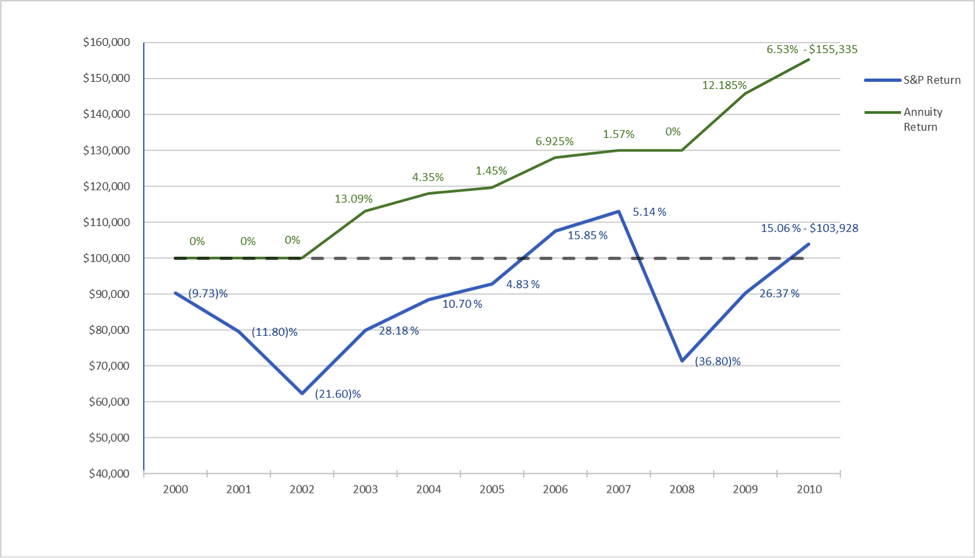
Year 2000 – 2010 (The lost decade)
 Click on image for enhanced viewing
From 2000 to 2010 the annuity performs significantly better than the S&P 500 by eliminating negative return years. The annuity would be worth $155,335 and the S&P 500 investment would be worth $103,928.
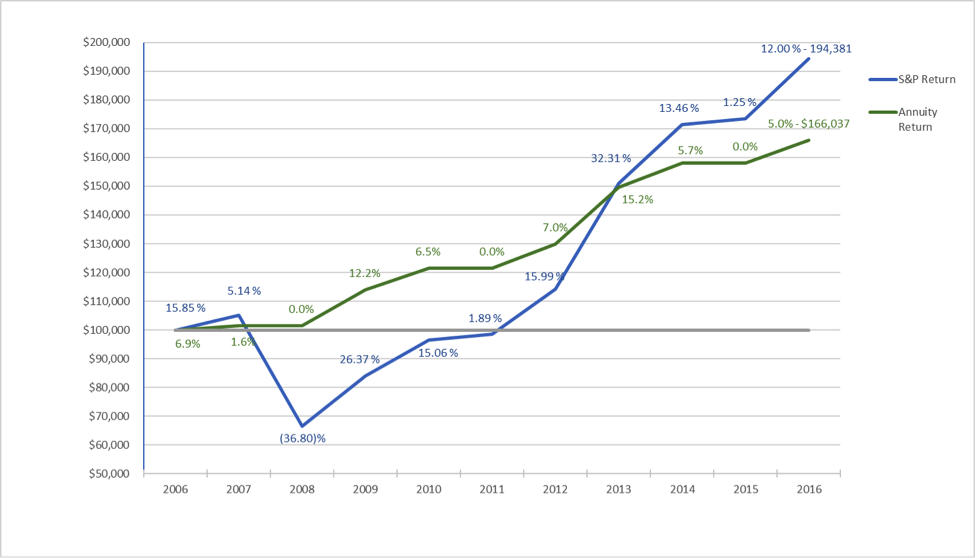
Year 2006 – 2016 The great financial crisis followed by a bull market
 Click on image for enhanced viewing
In this case the S&P 500 performs better by taking greater advantage of high returns years. The annuity would be worth $166,037 and the S&P 500 investment would be worth $194,381.
What I find interesting is that the annuity still had a substantial return compared to the much riskier S&P 500. Many retirees would not be invested fully in the S&P 500, but would still have to compete with market risk in their investment portfolios.
Before we dive deeper into using annuities for accumulation, let’s take a quick detour to review income riders and the cost of their “guarantees”.
Income Riders
Most annuities sold today have income riders. We rarely use income riders but this is a worthy sidebar to touch on. An income rider is an income guarantee that is separate of the real returns credited to the actual cash value of your annuity.
As we discussed above, we look for annuities that have downside protection and uncapped upside. These are real returns for the real money in your annuity. Income riders guarantee something different. They guarantee a systematic payback of your own money to you which will continue even after your money runs out. This sounds great on paper, but those systematic payouts aren’t as lucrative as the income guarantee returns might imply.
If you buy an annuity for $100,000 and the income guarantee is 8%, the guarantee will double in 9 years. This means that you will have $200,000 for the sake of those systematic income payments from the insurance company. The catch is simple, you can’t take that $200,000 and run because it’s not real money.
The $200,000 is a fictitious number used to calculate your income payment. The annual percentage payout of the $200,000 is determined based on your age. If for example you want to trigger the income at 65 and the payout is 5%, you will be paid $10,000 a year for the rest of your life. In this case it will take 20 years to pay $200,000. Your real investment was $100,000, 9 years ago, which means it took 29 years to double your initial investment from $100,000 to $200,000.
Many people are sold on the income growth, which in our example is 8%. This is misleading because the real returns of these income payments over an average life expectancy are priced to yield a return that is similar to the 10 year Treasury rate. As I write this that rate is only 2.87%. This is far from the 8% guarantee many people are sold on. Additionally, you have to pay for these income guarantees which reduces your real cash accumulation significantly. That’s the opposite of what we want.
For this reason we rarely us income guarantees in this interest rate environment.
Using Annuities for Accumulation as Part of the Portfolio
We’ve established a couple important points. First, find annuities that have uncapped positive returns with principal protection and second, steer clear of income riders and other high priced guarantees, usually. A couple other good rules to follow when considering an annuity for accumulation are:
- Pay attention to the participation rate of the crediting, for example, 60% of the S&P will give you more upside than 50%.
- Make sure if there is a fee that it acts as spread and is only charged if there is gain. Some annuities will charge a fee that will come out of principal even in 0 gain years, resulting in an actual loss.
- Try to pick the shorter surrender schedule if you have options, even if the crediting is slightly less.
In general, keep the fee schedule as low as possible by not attaching additional rider guarantees. Guarantees are expensive and tend to be used more as a sales tactic than added value. You already have the guarantee that your principal is protected. Stick with that.
If these rules are followed for appropriate annuity selection and a small percentage of a portfolio is allocated to an annuity with an accumulation objective, it can be a fantastic way to augment the risk & return ratio of the portfolio. Here is an example of what I mean.
Comparative Portfolios
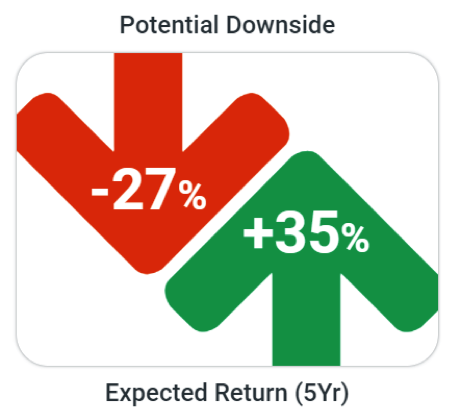
A typical moderate risk-based portfolio is going to move about half as much as the S&P 500 (beta of .5) and have a risk & return profile similar to the red and green picture below:
 100% allocated to a moderate portfolio
In a typical recession the expected loss of this moderate portfolio is about 27% (the red number). The total predicted return over the next 5 years is 35%, or 6.182% annually. These are hypothetical numbers modeled from our risk software.
One of the objectives of diversification is to maximize the amount of potential upside for every unit of potential downside risk you take in your portfolio. That means the goal should be to keep the green number as high as you can and reduce the red number by as much as possible.
Of course, this is all predictive and hypothetical modeling, but that doesn’t eliminate the value of good diversification.
What happens when you combine this moderate portfolio with an annuity built for accumulation?
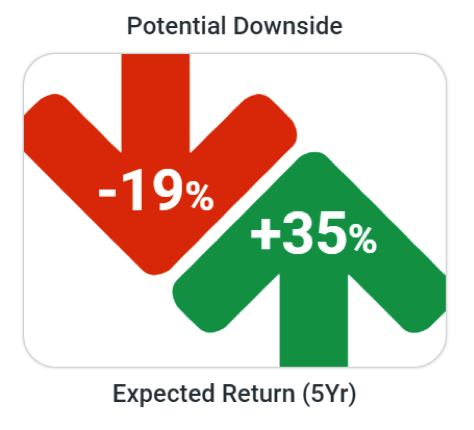
Let’s look at the risk & reward profile of a portfolio that has allocated 70% to the same moderate portfolio and 30% to an annuity. The annuity has an annual hypothetical upside of 6% with no downside.
 70% allocated to moderate portfolio & 30% allocated to annuity
The expected return of the portfolio stays at 35%, matching the moderate portfolio with full market exposure, but the downside reduces from 27% to 19%.
The upside potential is identical, but the downside risk is about 8% less. Unlike with a bond, the better the market does, the higher that green number will ultimately be.
It’s important to remember that in order to improve the expected risk & return ratio of your portfolio you have to give up liquidity in the portion allocated to the annuity. If the annuity has a 10 year surrender term, you should plan to not withdraw or surrender the annuity in excess of the free annual withdrawals until the 10 years is up.
Even more importantly, if you don’t choose the right annuity you won’t give yourself the opportunity for the type of risk-adjusted returns you see above. The majority of annuities do not offer this return potential, instead they charge you for guarantees that are costly and misleading. You must know the ins-and-outs of what you are using and how to use it.
If you are looking for a professional you can trust to help you do this, call us at 480-818-8300.
Disclosure – All numbers used for examples and illustrations are hypothetical. Arbor Retirement Solutions does not guarantee that any particular scenario will occur as modeled or illustrated. Past performance is not a guarantee of future results.